NCache Performance Benchmarks
2 Million Ops/Sec
(5 Node Cluster)
Executive Summary
NCache can help you linearly scale and enhance performance easily and cost-efficiently. Fortune 500 companies across the world have trusted NCache for over 13 years to remove performance bottlenecks related to data storage and databases and to scale .NET applications to extreme transaction processing (XTP).
This document will use NCache 5.0 with modern APIs and some new features to demonstrate the linear scalability and extreme performance you can get achieve for your .NET applications. In this experiment, we bundled a modem NCache API with a partitioned cache topology with pipelining enabled. Data is fully distributed on all caching servers and clients connect to all servers for read and write requests.
In this benchmark, we demonstrate that the NCache cluster can linearly scale and that we achieved 2 Million Transactions per second using only 5 cache server nodes. We will also demonstrate that NCache can deliver sub-microsecond latency even in a large cluster. In this whitepaper, we will be covering benchmark settings, steps for performing benchmarks, testing configurations, load configurations and results. You can see the benchmark experiment in action in this video.
Benchmark Setup Overview
Let’s review our benchmark setup. We are going to use AWS m4.10xlarge servers for this test. We have five of these NCache servers on which we will configure our cache cluster. We will have 15 client servers, from where we will run applications to connect to this cache cluster.
We are going to use Windows Server 2016 as the operation system – Data Center Edition, 64-bit. The NCache version being used is 5.0 Enterprise. In this benchmark setup, we will be using a Partitioned Cache Topology. In a Partitioned Cache Topology, all the data will be fully distributed in partitions on all caching servers. And all clients will be connected to all servers for read and write requests to utilize all servers at the same time. We don't have replication turned on for this topology but there are other topologies such as the Partitioned-Replica Topology which comes equipped with replication support.
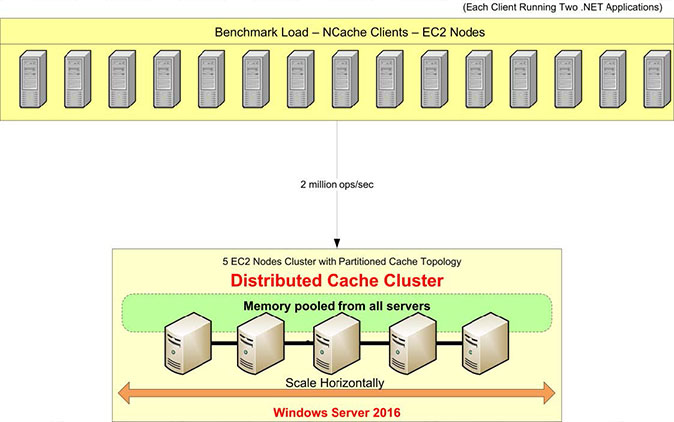
We will have Pipelining enabled which is a new feature in NCache 5.0. It works in such a way that on the client side it accumulates all requests which are happening at runtime and it applies those requests at once on the server-side. Accumulation is done in micro-seconds so it is very optimized and it is the recommended configuration when you have high transactional load requirements.
Here is a quick overview of our benchmark setup including hardware, software, and load configurations.
Hardware Configuration:
| Client & Server Details (Virtual Machine) |
AWS m4.10xlarge: 40 Cores, 160 GB Memory, Network - 10 Gbps Ethernet |
| No. of Server Nodes | 5 |
| No. of Client Nodes | 15 |
Software Configuration:
| Operating System | Windows Server 2016 Data Center Edition – x64 |
| NCache Version | 5.0 |
| Cluster Topology | Partitioned Cache Configuration |
Load Configuration:
| Cache Size | 4 GB |
| Data Size | Byte array of size 100 |
| Total Items | 1,000,000 |
| Pipelining | Enabled |
| Get/Update Ratio | 80:20 |
| Threads | 1280 |
| Applications Instances | 2 Instances per Client Machine , Total 30 Instances |
Data Population
After our benchmark environment setup, we will start with a data population of 1 Million items in the cache cluster. We will run the Client application (Cache Item Loader) which is going to connect and add 1 Million items in the cache. One client will connect with all caching servers and will add 1 million items in the cache cluster, after which we can get started with read and write requests.
You can use this Nuget package – NCache SDK to install SDK on the client machine and configure pipelining between the client-server and deploy the Load Generation Application (GitHub) to populate 1 million cache items on the cache cluster.
Build Transaction Load
We will now run the application to build some transactional load on this cache cluster with 80% read and 20% write operations. You can monitor all activity using Perfmon counters. Initially, we will connect 10 clients instances to each NCache server with activity on fetches as well as on updates per second.
Stage 1 1 Million Ops/Sec Transaction Load
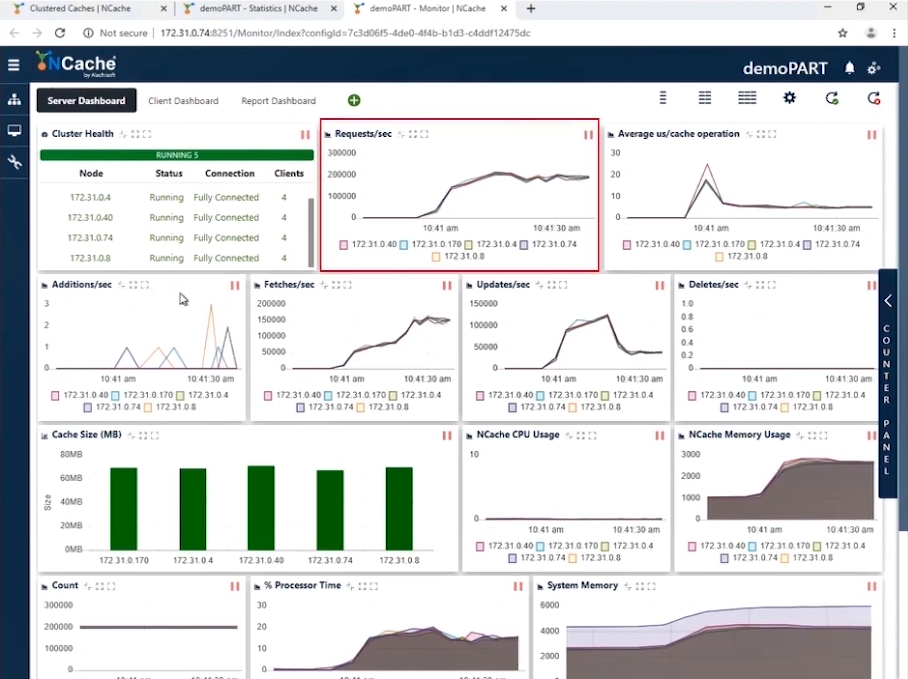
You can see in the screenshot that with 10 client instances connecting to a 5-node cluster we have requests per second numbering between 180,000 to 190,000. And since we have 5 NCache servers which are working in parallel, accumulating these requests brings us to 1 Million requests per second by this cache cluster.
We have efficient Memory and CPU usage and the average microsecond/cache operation is a little less than 10 microseconds per operation. Our stage one is completed where we have achieved 1 Million Operations per second from our cache cluster.
| Stage 1 – Summary Data Sheet | |
| Total Cache Servers in Cluster | 5 |
| Total Client Instances Connected | 10 |
| Requests Per Second / Node | 180,0000 ~ 190,000 |
| Total Requests - Cache Cluster | 950,000 ~ 1,000,000 |
| % Processor Time (Max) | 20% |
| System Memory | 4.2 GB |
| Latency (Microsecond/Cache Operation) | 10 microsecond/operation |
Stage 2 1.5 Million Ops/Sec Transaction Load
Now that we have achieved the 1 Million TPS, it’s time to bump up the load in the form of more application instances to increase the transactional load. And as soon as these applications would run, you would see an increase in requests per second counter. We are going to increase the number of clients to be 20. With this configuration you can see in the screenshot below that we are now showing 300,000 requests per second per instance. We have successfully achieved 1.5 Million requests per second from this cache cluster.
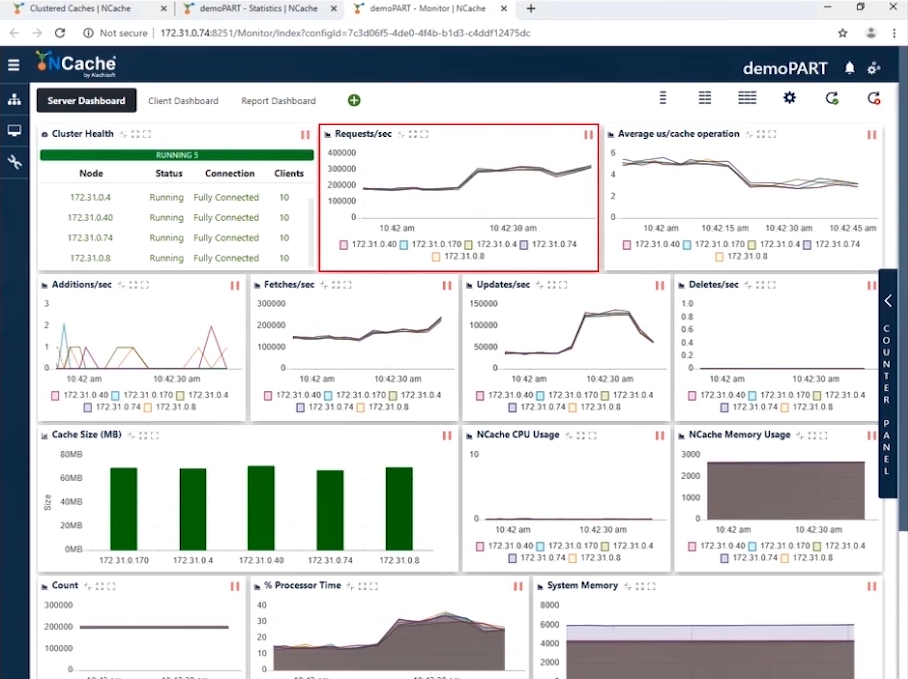
You can see the count of requests per second by each server is 300,000. Fetches are little more 200,000 per second and updates are between 50,000 - 100,000 and you can see the average microsecond per cache operation is less than 4 microseconds; that’s amazing because we have very low latency along with the impact of pipelining. When you have a high transactional load from the client end, pipelining really helps and reduces latency and increases throughput. This is why we recommend this to be turned on. Furthermore, we have the average microsecond per cache operation now somewhere around 3-4 Microseconds per cache operation.
| Stage 2 – Summary Data Sheet | |
| Total Cache Servers in Cluster | 5 |
| Total Client Instances Connected | 20 |
| Avg. Requests Per Second / Node | 300,000 |
| Total Requests - Cache Cluster | 1,500,000 |
| % Processor Time (Max) | 30% |
| System Memory | 6 GB |
| Latency (Microsecond/Cache Operation) | 3 ~ 4 microsecond/operation |
Stage 3 2 Million Ops/Sec Transaction Load
Let’s further bump up the load by running some more application instances which will also show a further increase in requests per second. We are now going to connect 30 clients’ instances to all NCache servers.
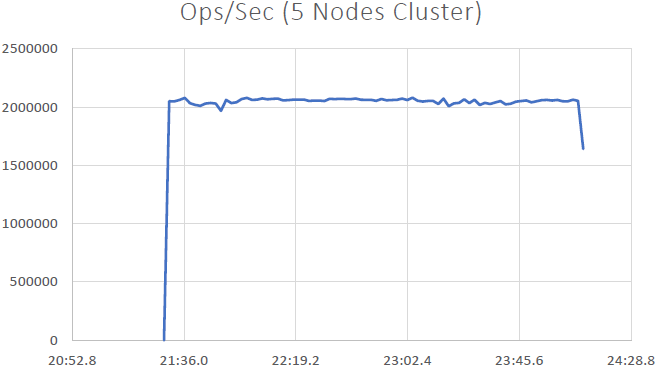
As per the screenshot below you can now see we have successfully touched 400,000 requests per second which we are getting by each NCache server; we have 5 NCache servers so that makes the number up to two million transactions per second by this NCache cache cluster. And we have the average microseconds per cache operation numbering less than 3 microseconds. We also have the system memory and processor time well under limits with 40 - 50 % utilization on both fronts.
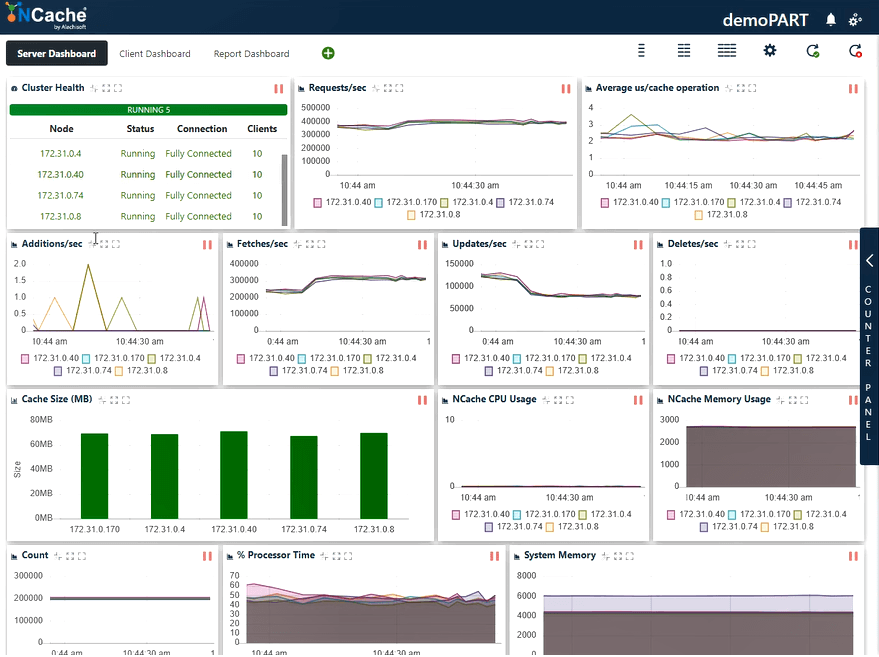
We now have 2 ~ 3 us/operation latency, an improvement from the previous result. You can once again see a mix of fetches, updates, and an efficient utilization of the CPU and memory resources. We can conclude here that NCache is linearly scalable. Now let’s review our scalability numbers.
| Stage 3 – Summary Data Sheet | |
| Total Cache Servers in Cluster | 5 |
| Total Client Instances Connected | 30 |
| Avg. Requests Per Second / Node | 400,000 |
| Total Requests - Cache Cluster | 2,000,000 |
| % Processor Time (Max) | 60% |
| System Memory | 6 GB |
| Latency (Microsecond/Cache Operation) | 2 ~ 3 microsecond/operation |
Benchmark Results
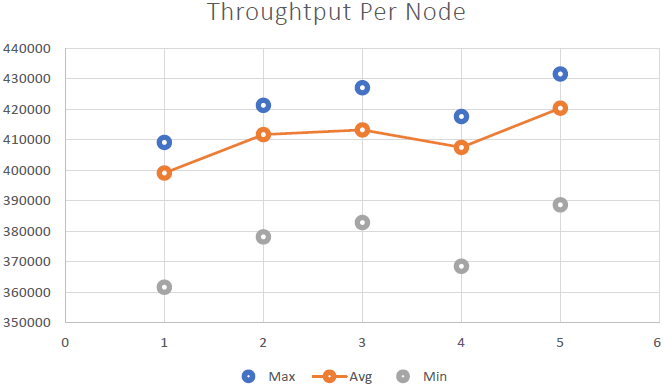
We were able to demonstrate that NCache is linearly scalable and we were able to achieve the following results after running the benchmarks:
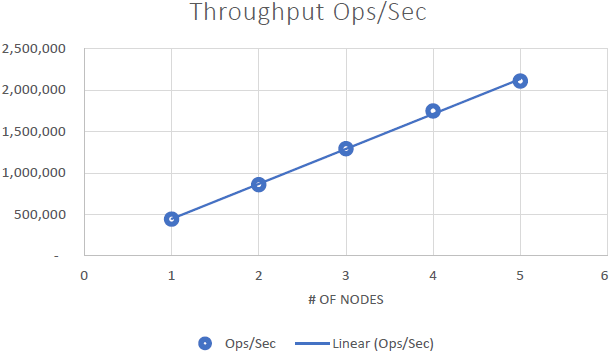
Conclusions
- Linear Scalability: With 5 NCache servers we were able to achieve 2 Million requests per second. Adding more and more servers means more request handling capabilities from NCache.
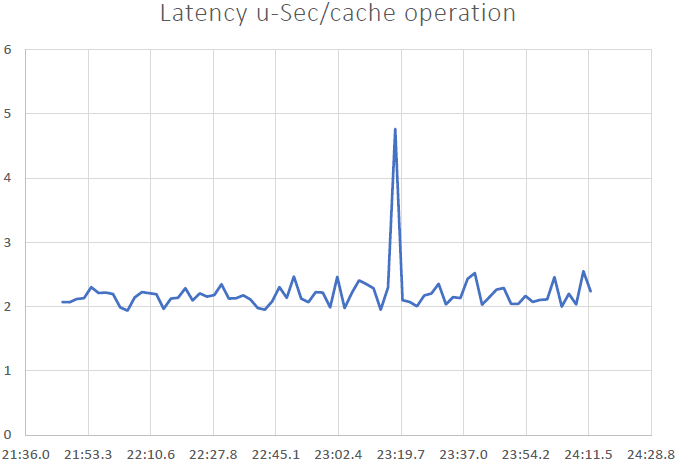
- Low Latency & High Throughput: NCache delivers sub-microsecond (2.5 ~ 3 micro-second) latency even with a large cluster size. NCache helps meet low latency and high throughput requirements even at scale. We have a very low latency, an impact derived from pipelining. When you have high transactional loads from the client end, pipelining really helps and reduces latency and increases throughput.